
01 · Foundation & course context
Reconfigure the memory system. Explain the trade-offs.
Arches is a cycle-level hardware simulation framework developed by the Utah Graphics Lab at the University of Utah. It lets researchers configure processors, caches, and interconnects to study parallel architectures and measure their performance. This ongoing course project builds on that framework: my work focuses on C++ memory-system changes and ray tracing experiments. The results below are interim findings and will be updated as the project progresses.
Both cache topology and resource allocation change. This is not an isolated test of adding L3.
Implementation details
Arches is a cycle-level hardware simulator built by the Utah Graphics Lab. It models a ray tracing GPU (TRaX) cycle by cycle and runs a real RISC-V kernel on the simulated hardware. My work is on the memory hierarchy: reconfigure it, run the same workload across configurations, and use the per-cache statistics to explain why one design beats another.
This is an ongoing school course project built on the University of Utah’s Arches framework, not a completed research result or a simulator I authored. The configurations, measurements, and interpretations shown here are interim work and will be updated as experiments continue. All performance numbers are simulated cycle counts, not measurements on real silicon, and apply to the workloads and configurations tested.
- Four Sponza architecture runs at 1024 × 1024 and 1 sample per pixel use byte-identical kernel binaries
- Cornell Box uses a separate path-tracing workload at 1024 × 1024 and 64 samples per pixel
- Configuration records and per-cache counters accompany the cycle measurements
02 · The experiment
Scale the cores, then add a cache level and watch it backfire.
The same Sponza kernel exposes both the regression and the recovery. The original 64-TM two-level configuration remains the fastest of these four runs.
Simulated cycles · lower is better
- 8 TM · two levels9,605,232
- 64 TM · two levels1,843,987
- 64 TM · three levels8,624,870
- 64 TM · tuned three levels2,257,327
Simulated cycles, not real GPU timings. All bars start at zero. Four kernel binaries have the same SHA-256; values are available in the CSV below.
Implementation details
Increasing thread multiprocessors from 8 to 64 reduced simulated cycles from 9,605,232 to 1,843,987: a 5.21x speedup rather than ideal 8x scaling. Cache and stall counters provide the next diagnostic step; the scaling ratio alone does not identify the bottleneck.
I rebuilt the hierarchy around cluster-local L2 caches, a chip-wide crossbar, an L3, and DRAM, and addressed request-bitfield and store-bypass-mask limits along the request path. The initial three-level design took 8,624,870 cycles. Tuning cluster size and miss-tracking resources reduced it to 2,257,327 cycles—73.8% fewer than the untuned design, but still 22.4% more than the original 64-TM two-level baseline.
- 8 to 64 TMs: 9,605,232 to 1,843,987 cycles
- Adding the third level as specified: 8,624,870 cycles—4.7x slower
- After tuning: 2,257,327 cycles; 3.82x faster than untuned, not faster than the two-level baseline
03 · What the data showed
A lower stall count, with almost the same hit rate.
The tuned three-level design has far fewer aggregate MSHR stalls, while L2 hit rate barely changes. Several resources changed together, so this is evidence for a bottleneck hypothesis—not a single-variable causal proof.
Implementation details
L2 hit rate fell from 80.98% in the shared, address-partitioned design to 40.50% with cluster-local L2 caches. The tuned configuration doubled aggregate L2 capacity yet reached only 40.52%. This is consistent with reduced sharing and replicated data, but hit rates alone do not isolate replication from all other effects of the topology change.
The tuned configuration changes both sharing from eight to four TMs per L2 and miss-tracking capacity. Its aggregate L2 MSHR stall counter falls from 221,852,198 to 5,013,738, about 44.2x lower. MSHRs track outstanding cache misses; the counter supports investigating miss concurrency, not attributing the entire speedup to one isolated parameter. These are aggregated stall counts, not elapsed frame cycles.
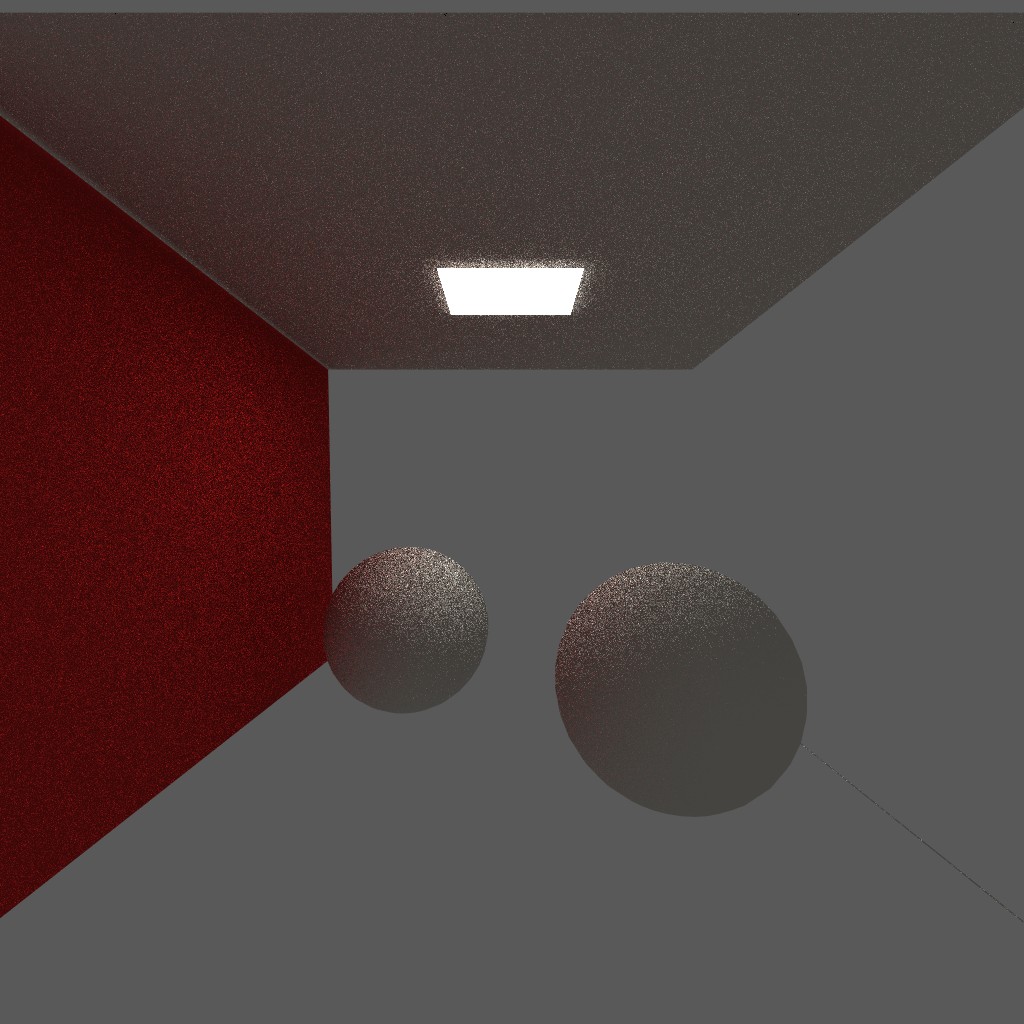
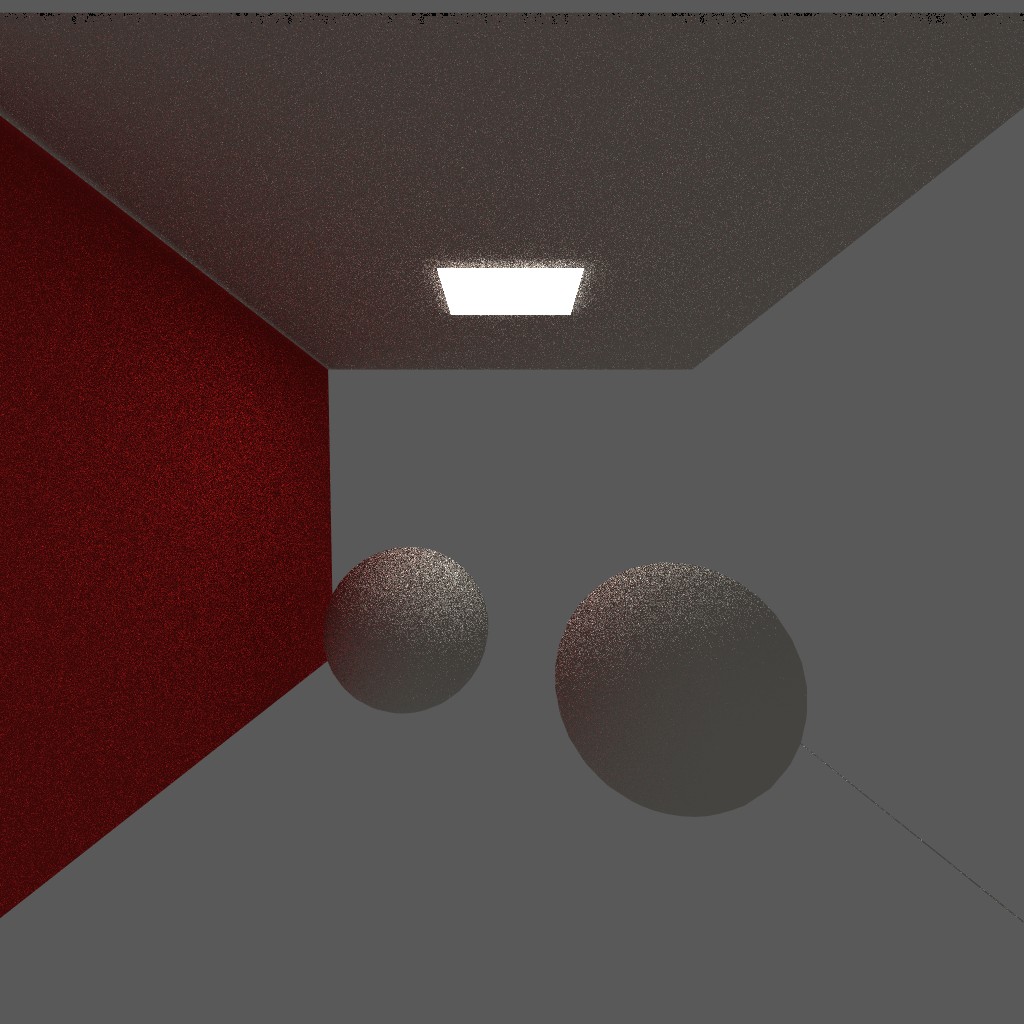
A separate Cornell Box path-tracing test records 6,791,039 cycles for the two-level design and 6,770,578 for the tuned three-level design: a difference of about 0.3%. This smaller scene does not show the Sponza regression. It is a workload-specific comparison, not proof that clustering is harmless whenever a BVH fits in cache. The images below show the rendered scene; they are not a performance visualization.
04 · Where it stands
Separate sampling changes from scheduling changes.
The next step is a tighter experiment: keep the ray set fixed, change one variable, and repeat the measurement. Sampling jitter is not merely reordering the same rays.
- ControlFreeze the workloadSame ray set and random inputs
- ExperimentChange one variableOrdering or one cache parameter
- ValidateCompare output + cyclesReport the baseline and limits
Implementation details
A separate 256 × 256 Sponza sampling sweep is exploratory. At one sample per pixel, enabling primary-ray jitter increased cycles by 22.7% in the tuned three-level configuration and 2.2% in the two-level one. Jitter changes ray directions and consumes random numbers used by later bounces, so this is not a controlled ray-ordering experiment. It shows sensitivity to the sampling workload; it does not isolate scheduling or locality as the cause.
Next experiments should hold a ray set fixed while changing only its execution order, and vary cache parameters one at a time. Other candidates include retaining the shared address-sliced L2 with an L3 behind it, and separating BVH reads from framebuffer writes. Results from these ambient-occlusion and simple path-tracing workloads do not establish a lower bound for production renderers or real GPUs.